


The Child Tax Credit
An overview of the arguments in favor of and opposed to one of the most hotly-debated policies in the United States.

Unless you’ve been living under a rock for the past year, chances are you’ve heard the Child Tax Credit (CTC) being discussed quite a bit in the news. An integral part of Joe Biden’s American Rescue Plan, it’s been a hot topic for either side of the political aisle. In this post, I’m going to attempt to explain just what the CTC is, as well as the arguments in favor of and against it.
NOTE: This is a very long post (almost 4k words!!!). I’d recommend you read it in bite-sized portions. Of course, if you feel brave enough to tear through the entire thing in one sitting, more power to you!
With that out of the way, let’s get started!
The Child Tax Credit: What on Earth is it?
Before we can talk about the policies being discussed right now, it’s probably a good idea to develop an understanding of the history of the CTC.
The very first time the United States implemented an official Child Tax Credit was during the Clinton Administration, under the Taxpayer Relief Act of 1997 (TRA). Under the TRA, families with qualifying children under the age of 17 would be given a $500 non-refundable tax credit which would begin phasing out at a rate of $50 for every $1000 earned above a threshold of $110,000 for married couples filing jointly, $75,000 for heads of household, and $55,000 for single filers. The Act also provided a refundable credit for households with three or more qualifying children, and was not indexed for inflation.
Over the following years and through 4 more administrations, the CTC would see a number of changes. We can ignore most of these for the time being: the change most relevant to this discussion came under the Tax Cuts and Jobs Act of 2017 (hereafter referred to as the TCJA).
The CTC Under the Trump Administration:
Under the TCJA, the CTC was expanded to $2000 per qualifying child and the refundable portion (often referred to as the Additional Child Tax Credit or ACTC) was raised to $1400. The tax credit also required at least $2500 in earned income before a household could start receiving benefits (this becomes especially important later on in the discussion). It also expanded the phaseout thresholds to $200k for unmarried filers and $400k for married taxpayers filing jointly.
These changes were set to remain active until 2025.
A Global Pandemic:
Despite the TCJA offering a substantial expansion of the CTC, it quickly became insufficient with the emergence of the COVID-19 pandemic during 2020. The virus spread like wildfire, forcing multiple countries to go into lockdown before the end of the year.
Millions of workers were either placed on furlough or completely laid off. Poverty rates skyrocketed, especially amongst households with children, who were already experiencing higher poverty rates than the rest of the population. Calls for more expansive welfare programs were being made across the country.
In response to the ongoing recession, the Biden Administration passed the American Rescue Plan (ARP) in order to provide direct cash assistance to American families struggling with unemployment.
Arguably the most important part of the legislation (certainly the most important for this article) was the expansion of the Child Tax Credit. Under the ARP, the CTC was made fully refundable, and payments were expanded to $3600 per child below the age of 6 and $3000 per child between ages 6 and 17. The program also eliminated the earnings threshold of $2500 that households had to meet before receiving benefits, effectively converting the program into a child allowance. Payments began in March of 2021, terminating in December of the same year (despite strong cries to keep them running).
The following charts show the benefit schedules for the CTC before the TCJA (2017), during the TCJA (2018), and under the ARP (2021):

During this time, the Biden Administration also announced a push for the American Families Plan, a bill that would seek to make permanent a number of ARP provisions — CTC expansion being one of them.
Ever since this announcement, the field of economics has rushed to answer one question: Should the United States make the expansion of the CTC permanent?
Here’s a “brief” summary of what the literature says.
A Step Forward in Reducing Child Poverty:
The International Perspective:
One of the easiest ways we can assess the efficacy of the CTC expansion would be to analyze the effects of similar policies in other countries. Luckily for us, our maple-loving neighbors to the North are a perfect example.
Back in 2016, Canada instituted it’s Canada Child Benefit Program (CCB), a semi-universal child allowance program that reached over 90% of Canadian households with children. The program offers over $6,000 per year to qualifying households with children under 6 years old, and over $5,400 per year to households with children between ages 6 and 17.
The results of the program are incredibly encouraging, slashing child poverty rates by almost a third:
Introduced in 2016, the CCB has already been credited for contributing to a decline in child poverty from 11% to 9 percent.
The graph below shows the income distribution of families with children during the 2017 - 2018 benefit year, highlighting what it would look like without CCB income. The lightest regions represent families that would have been below the poverty line had they not received the benefits.

By as early as 2019, the program had moved over 350,000 families (or 750,000 children) above the $20,000 income level (CANCEA, 2019).
Line Go Up, World More Gooder:
This all has nothing to say about the economic benefits of the CCB program, which look just as promising:
Since its introduction, the CCB has contributed an estimated $139 billion to Canada’s GDP. This represents 2.1% of Canada’s total GDP over the same time period.
The reason for this is quite simple: As lower-income families receive benefits from the CCB, they gain the ability to spend more on goods and services. As these expenditures rise, they’re multiplied throughout the rest of the economy as businesses hire more employees and purchase more resources in order to sate the rising demand. This rippling effect leads to an expansion of the economy as a whole.
Beyond just GDP, the CCB benefits had a substantial impact on a number of other economic indicators. The program was directly responsible for approximately $132 billion in total annual output, $26 billon in Gross Operating Surplus, and $40 billion in Labour Income since 2016 (CANCEA 2019).


The resulting economic expansion also created approximately 1.4 million jobs, breaking down into 418,000 full-time and 70,300 part-time jobs per year.
All in all, both the anti-poverty and economic effects of the Canada Child Benefit Program appear to have been incredibly beneficial to Canada’s economy, creating a strong case for such programs here in the U.S.
A More Domestic Outlook:
But of course, as many skeptics would be right to point out, Canada is not the United States. This might make it difficult for some people to believe the policy would have the same effects here in the US (despite the two economies being quite similar).
Fortunately, a number of organisations have also conducted studies into the effects of CTC expansion on our own economy.
A particularly interesting paper from the Urban Institute predicted the effects of a variety of adjustments to the existing CTC — from maintaining the current benefits and simply making it fully refundable to pushing a full-on expansion. Here’s what they found:
Expanding the CTC would reduce child poverty by 5.9 percentage points, from 14.2 to 8.4 percent, using 2018 as a benchmark for a typical year (percentages rounded to nearest tenth). That means 4.3 million fewer children would be in poverty in a typical year, representing over a 40 percent decrease in child poverty.

Of the proposed changes to the credit, full refundability had the most significant impact on poverty reduction:
If the credit were made fully refundable, but with the dollar amounts kept the same as before the ARP ($2,000 per eligible child) and 17-year-olds remaining ineligible, then 2.2 million children would be removed from poverty. If instead the dollar amount of the credit was increased to the ARP amount ($3,600 for young children and $3,000 for older children) but the credit was not made refundable, 166,000 children would be removed from poverty.
— Acs and Werner (2021)

As shown by the table above, however, combining refundability with the expansion of the actual payments would almost double the anti-poverty effects of just making the credit fully refundable. They also go on to review the effects the expansion would have on children near the poverty line, as well as those in deep poverty.
Not only would expanding the CTC reduce poverty, it would reduce the share of children living in deep poverty (below 50 percent of the supplemental poverty level) by 1.5 percentage points as well as the share living in near poverty (below 200 percent of the supplemental poverty level) by 3.2 percentage points.
— Acs and Werner (2021)
A Consensus is Forming:
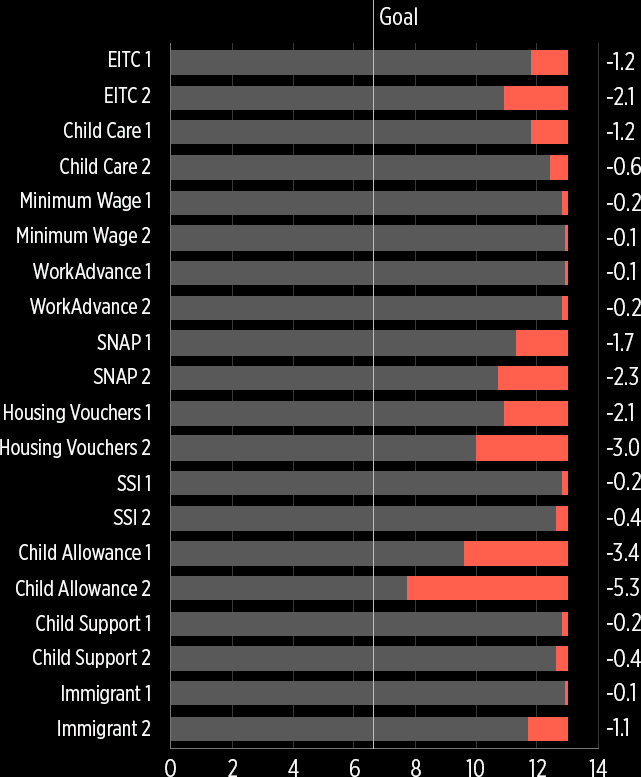
Acs and Werner (2021)’s findings are further echoed much more comprehensively by the National Academy of Sciences, who released a report last year of their primary policy suggestions to reduce child poverty. In it, they compare the anti-poverty effects of creating a universal child allowance with a number of other proposals to reduce child poverty:
A $3,000 per child per year child allowance policy would produce the largest poverty reduction, and it would meet the goal of reducing deep poverty (50 percent of SPM poverty) by half.
— NAS (2019)
The child allowance program they propose is practically indistinguishable from the expansion of the CTC put forth under the American Families Plan, under which households with children would receive at least $3,000 per year for each qualifying child.
The committee explored quite a few other programs, from expanding the Earned Income Tax Credit (EITC) to increasing immigrants’ access to welfare. The child allowance outlined above had by far the most significant impact, reducing the child poverty rate by 5.3 percentage points (close to 35%).1
So Why Not Implement It?
Everything I’ve outlined above suggests that the expansion of the CTC would be incredibly beneficial to the United States, both in it’s anti-poverty and economic stimulus effects.
Now you may be wondering to yourselves “why is there still an argument about this?” Two words: Labour supply.
The most common talking point you’ll hear from skeptics is that the expansion of the CTC would lead to a reduction in employment among recipients. After all, why would they go to work if the government’s just gonna hand them money?
This is a concept in economics known as the income effect, which essentially argues that increases in income that don’t change the marginal return on future earnings will ultimately reduce the incentive to work. By unconditionally handing out cash to families with children, the CTC does exactly that.
Fortunately for us, the NAS report already accounted for this in their study.
“… behavioral responses for Policy #1 were not large enough to change its substantial 3.4 percentage point drop in child poverty. The employment effects for Policy #2 reduced poverty reduction slightly—from 5.4 to 5.3 percentage points.”
This translates to a job loss of approximately 120,000 people.
“So that settles it, right? There’s no way that expanding the CTC would cause enough of a reduction in employment to substantially change it’s anti-poverty effects.”
Well, not quite.
A New Challenger Approaches:
In November of 2021, the University of Chicago’s Becker Friedman Institute (BFI) released a new working paper on the impact of expanding the CTC. In it, they set out to answer many of the same questions tackled in NAS (2019). Specifically, they focused on the dynamic effects of CTC expansion on the labour supply.
The authors argued that the methodology used by NAS (2019) to estimate labour supply effects were deeply flawed; their key criticism is that, while the committee addresses the income effect accurately, they fail to account for a substitution effect that would result in a reduction in the financial incentive to work for families within the phase-in period of the credit.
By replacing the TCJA CTC (which contained substantial work incentives akin to the EITC) with a universal basic income-type benefit, the CTC expansion reduces the return to working at all by at least $2,000 per child for most workers with children. Relying on elasticity estimates consistent with mainstream simulation models and the academic literature, we estimate that this change in policy would lead 1.5 million workers (constituting 2.6% of all working parents) to exit the labor force.
— Corinth et al. (2021)
There’s a lot to unpack here. Before we dive into the findings of the paper, it’s important to understand exactly how CTC benefits are calculated.
Trapezoids and Rectangles:
The chart below depicts the way CTC benefits are set up under the TCJA (represented by the solid line) vs how they would be handled under the AFP (represented by the dashed line).

As you can see, the TCJA benefits don’t start at their maximum rate; instead, they phase in as incomes rise past a certain threshold, currently set at $2,500 per year (I told you this would be important later). Once they reach a certain level (currently around $30,000), the phase-in stops and the benefit maxes out, creating the shape of a trapezoid.
The proposed expansion would universalize the benefit. This would eliminate the phase-in period, giving households a cash payout without requiring them to have prior earnings. The benefits would continue at the maximum rate until they eventually reach the phase-out period, creating the shape of a rectangle.2
Seems simple enough, but how does this relate to Corinth et al. (2021)?
The Financial Return to Working at All:
Corinth et al. argue that the elimination of the phase-in period would create a substitution effect between the two policies and remove what they refer to as the financial return to working at all.
The concept is simple: Similar to how progressive tax brackets serve to tax higher earnings, the phase-in period of the CTC serves to subsidize those earnings. The more money you’re earning from work, the more money you’re going to receive from the CTC. This means that if you see a $1 increase in your wages, your total income will rise by that dollar plus the benefit from the CTC, creating an incentive for people to continue raising their earnings up until the point where the subsidy ends and payouts become flat. It’s the removal of this incentive, they argue, that would cause the most substantial reduction in the labour supply.3
The graph below shows the percent reduction in the financial return to work caused by the expansion of the CTC.
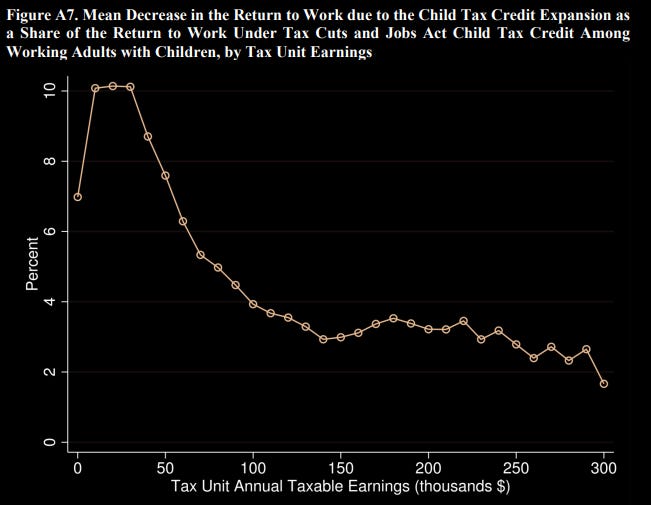
Using historical data on labor market responsiveness to the financial return to work, they estimate a total loss of 1.32 million jobs across income brackets, as detailed in this chart:

As you can see, most of the job loss is concentrated in the $0-$50,000 range, meaning the brunt of this impact is felt by households living near or below the poverty line.
What This Means for the CTC:
Obviously, this is bad: This is the last group of people whose earning’s we’d want to see reduced as a result of an exodus of workers, as it may significantly dampen the anti-poverty effects of the program.
The paper goes on to estimate the impact of the labor market response by comparing the anti-poverty effects of a simulation that doesn’t take labor reductions into account (a “static” simulation) with one that does (a “dynamic” simulation). At first, the static simulation looks quite promising.
Using the CID, the overall poverty rate falls from 10.8% to 9.0%, a 17% reduction. Child poverty falls from 13.7% to 9.1%, a 34% reduction
Despite raising poverty thresholds 40 percent above official thresholds when using the CID, it is worth noting that the baseline level of deep child poverty remains strikingly low at 2.3%. It is on this low baseline rate that we estimate a 39% reduction in deep child poverty as a result of the CTC expansion.
— Corinth et al. (2021)


So not only is child poverty falling by approximately 34%, deep child poverty (the population of children living at or below half the poverty threshold) is falling by an astounding 39%.
In addition, they find that the program would become the single most significant anti-poverty program in the United States, beating out even the Earned Income Tax Credit (EITC).

This is fantastic! Based on these simulations, the expansion of the CTC would lead to an unprecedented reduction in child poverty rates. However, factoring in labor supply reductions results in a far less optimistic outlook:

Under the dynamic simulation, the anti-poverty effects of the program on children in poverty were reduced to just 22% (as opposed to 39% in the static simulation). In addition, the anti-poverty effects of those living in deep poverty were reduced to just 0.6% — almost nothing at all.
While this would still be an unprecedented reduction in child poverty, the results of the program are nowhere near as optimistic as the prior literature predicted.
But wait! There’s more!
Yet Another New Challenger Approaches:
So I was originally going to move directly into the “Key Takeaways” section of this post, but just as I was about to hit the “publish” button I thought I’d take one last look at the responses to Corinth et al. (2021). Lo and behold, I stumbled across a post at the Niskanen Center by Jacob Bastian (@JacobBastian25) in which he details his own paper that directly addresses the above report. Wanting to be as thorough as possible, I decided I’d hold off on publishing for a few days so that I could read through it and outline it’s main points of contention.
And oh my God, am I glad I did.
A Battle of Elasticities:
In his paper, Bastian attempts to replicate the findings of Corinth et al. (2021) using data from the Supplemental Poverty Measure and accounting for the reduction in return to work. However, his dynamic simulation makes one key change: It uses a smaller elasticity rate.
To those who are uninitiated, elasticity basically just measures the effect of a 1 percent change in one variable on the percent change in another variable. Here, it measures the percent change in the return to work on the percent change in employment rates at each income level.
These are the elasticities used in Corinth et al. (2021):
A 0.75 elasticity for single mothers.
A 0.25 elasticity for all other actors.
Whereas these are the elasticities used in Bastian (2022):
A 0.4 elasticity for low-income single mothers.
A 0.2 elasticity for all other mothers.
A 0.05 elasticity for all men.
Bastian (2022) argues that these lower elasticities are more representative of reality due to calculation errors in most of the previous literature:
“[E]xtensive margin elasticities around 0.25 are reasonable, while values above 1 are not.”
— Chetty et al. (2012) qted in Bastian (2022)
The paper he cites (Chetty et al. 2012) creates its own elasticities for labor responsiveness, while also taking a clearer look at the papers that came before it. They find that much of the prior literature fails to account for transfer benefits and alternative sources of income. As such, it seems evident that the 0.3-1.2 elasticity range often cited (and used in Corinth et al. 2021) is an overstatement.
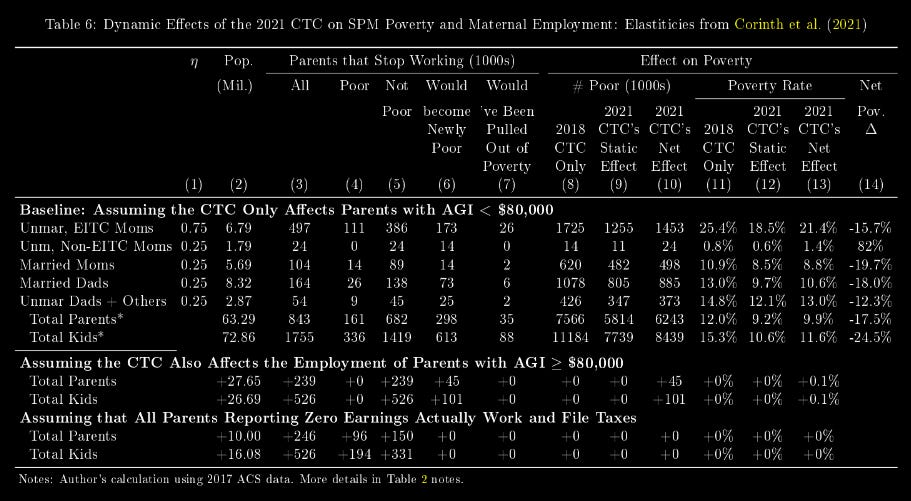
Using lower elasticities, Bastian (2022) creates his own dynamic simulation of the policy:


Okay, so there’s a lot of numbers here. But don’t worry, we only really need to focus on two: The net positive change on child poverty and deep child poverty. As you can see from the tables, Bastian (2022) predicts that, accounting for labour responses, CTC expansion would result in a 28.1% reduction in child poverty and a 48.5% reduction in deep child poverty. This is a big departure from Corinth et al. (2021)’s predicted 22% and 0% reductions respectively.
The lower elasticities predict that a significantly smaller number of workers would exit the labor market. Specifically, Bastian (2022) estimates a labor reduction of approximately 411,000 workers, as compared to Corinth et al. (2021)’s 1.32 million.
Now of course, this begs the question: “What if the higher elasticities are more accurate?” Well, as Bastian (2022) goes on to demonstrate, that may not even matter. Why? Because there’s one more methodological flaw in Corinth et al. (2021)’s report.
A House(hold) Divided:
I’ll just let Bastian (2022) do the talking for me:
“[Corinth et al. (2021)] restricts the employment impact on couples to either: both spouses stop working, or neither spouse stops working. In contrast, I assume that each adult independently decides whether or not to stop working… Assuming that both spouses stop working means that families that reduce their labor supply suer a much larger loss of total family income, and are more likely to fall into deep poverty.”
— Bastian (2022)
And of course, Bastian’s objection makes sense: There are plenty of cases where only one parent in a household would exit the labour force while the other continues working, as demonstrated by the labor market response to Canada’s CCB program (Koebel and Schirle, 2016)
This indicates that the estimates for those in deep poverty in Corinth et al. (2021)’s dynamic simulation are significantly overstated. In order to demonstrate this, Bastian (2022) runs his own dynamic simulation using Corinth et al.’s higher elasticities:
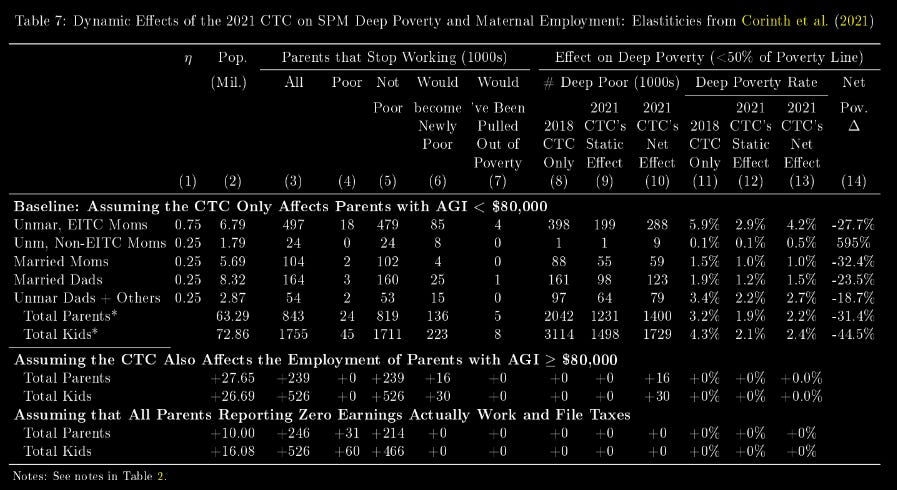
Like before, there’s only two numbers we need to pay significant attention to here: The net reduction in child poverty and deep child poverty. Using the higher elasticities, Bastian (2022) finds that the program’s impact on child poverty would fall from his estimated 28.1% to around 24.5% — in line with Corinth et al. (2021)’s 22% estimate.
However, the program’s impact on deep child poverty only falls from 48.5% to 44.5% — significantly higher than Corinth et al. (2021)’s shocking 0.6% prediction.
What this means is that, even at higher labor market elasticities, the expansion of the CTC would still make unprecedented reductions in both child poverty and deep child poverty, far above the estimates calculated by Corinth et al.
Or, in simpler terms, the reduction in employment resulting from expanding the CTC would not substantially reduce the anti-poverty effects of the program.
Key Takeaways:
Based on the current literature, it seems undeniable that expanding the Child Tax Credit would bring about an unprecedented reduction in child poverty and deep child poverty throughout the United States, slashing them by almost 25% and almost 50% respectively (NAS 2019, Acs and Werner 2021, Bastian 2022).
While the labor market response seems to be statistically significant (as shown by Corinth et al. 2021), it appears as though it wouldn’t substantially reduce the anti-poverty effects of the program (Bastian 2022).
In addition to it’s substantial impact on poverty, the program could arguably bolster the economy similar to Canada’s CCB program (CANCEA 2019).
However, there’s a few things I’d like everyone to keep in mind:
Economics is an ever-evolving science.
The findings in Bastian (2022) are incredibly fresh, with the latest update coming in literally on the day I published this post. The paper’s not even completely finished yet, with a multitude of figures yet to be added to the document. It hasn’t been peer-reviewed, and there hasn’t been ample time for any individual or institution to craft a response. It’s entirely possible that the findings will be debunked in a few months time — in which case I’ll probably make an update post talking about it.
At least for now though, I find it to be a compelling critique of Corinth et al. (2021), and am inclined to believe that the labor market response to expansion will not have as significant an impact on the program’s effects as initially thought.
These are still just simulations.
We don’t even know for sure how the expansion under the ARP affected labor markets during the brief period it was active — and it’s unlikely that we’ll get a full picture any time soon, as the labor market can take months, if not years, to respond to changes in tax structure.
Economists make predictions based on general models. It’s impossible for any individual or institution to account for every variable or potential market outcome and create a perfectly accurate forecast.
That being said, the predictions discussed in this post are very reassuring.
My Take:
Based on just this “small” fragment of the discourse, I’m confident in thinking that the expansion of the Child Tax Credit would be a good idea.
Now of course, it’s entirely possible that this position will change over time and as new information comes out. But for now I think this is the perfect opportunity for the United States to catch up to its fellow OECD countries in implementing stronger and more effective welfare policies. This is a chance to dramatically increase the standard of living for millions of impoverished children here in the United States, and it would be an absolute injustice not to pursue it.
Of course, whether or not we’ll get the chance in this political climate is a separate issue entirely — one I’d rather leave to the political science experts.
Some Bookkeeping:
You’ve reached the end of my first Substack post! I know this was a long read, but I wanted to be as thorough as possible in presenting the literature surrounding what’s arguably one of the most important policy debates of the decade.
Now that my first post is live, I wanted to take a second to talk about this blog moving forward.
I’d like to continue posting long-form content like this. I really like the prospect of trying to cover every facet of the issue I’m looking into.
This presents an issue, however: Between all the research, the extensive note-taking, and the entire writing process (drafting, writing, revising), this article took me approximately a month to write. Which is fine, by the way. I enjoy reading about this stuff and the longer I can spend on it, the better.
I don’t want to be relegated to only posting once a month, however.
So here’s my plan: Starting in March of 2022, I want to shoot for at least two articles a month; one short article in the middle of the month (<2000 words) and one longer, more thorough piece similar to this one at the end of the month.
If I find the time, I’ll also make smaller bite-sized posts covering updates on topics I’ve already covered or current events that don’t prompt such large amounts of research.
Knowing me, there’ll be times that I slip up on this rule. Bear with me. I had a great deal of fun writing this, and I hope it was an interesting read for all of you. I look forward to continuing this.
Thank you all so much for reading, and I’ll see you at next month!
The scope and significance of the findings in the NAS report are far too large for me to fully cover in this post. As such, I’d highly recommend those of you who are interested to follow the link posted above and take the time to read it yourselves. Just be prepared to spend a few weeks on it, it’s a long one!
The exact amounts for the phase-in and phase-out ranges for both the TCJA and AFP CTC were outlined at the beginning of this article.
It’s important to note that the BFI paper is not referring to the income effect. In fact, their analysis of the impact of the income effect lines up quite nicely with that of NAS (2019), with it resulting in an estimated 0.14 million job loss (not enough to substantially reduce the effects of the program).